Ethiopian and Libyan population and migration informationAN
The population of Ethiopia is growing extremely fast, with a Natural Increase Rate of 2.9% (CIA World Fact Book). The population of Ethiopia is currently at 93 million people. With a Crude Birth Rate of 38.07 and a Total Fertility Rate of 5.31 children born/woman, it looks like their population will continue to grow for some time (CIA World Fact Book). Ethiopia is currently in stage 2, the high growth stage, with a median age of 17.5 year old people. The current Infant Mortality Rate is 58.38 deaths out of 1000 live births. The usual life expectancy for a citizen of Ethiopia is 60 years. Also the probability of dying between 15 and 60 years per 1000 population in Ethiopia is 306/265 (World Health Organization). Ethiopia is partly undeveloped and some of the major risk factors affecting Ethiopian Youth are alcohol, tobacco and AIDS.
On the other hand, Libya exceeds Ethiopia considerably in population growth with a Natural Increase Rate of 4.85 (CIA World Fact Book). The current population of Libya is however, less than Ethiopia with 6,002,347 people. The Crude Birth Rate of Libya is at 18.74, and the Total Fertility Rate of 2.09 children born/woman (CIA World Fact Book). Libya is in stage 3, with a median age of 27 year old people. The usual life expectancy for a Libyan is 75.83 years, and the Infant Mortality Rate is 12.26 deaths/1000 live births. The probability of dying between 15 and 60 years is 411/134 (World Health Organization). An effect of Libya's high growth is that one of the main problems it has are AIDS, and road traffic injuries.
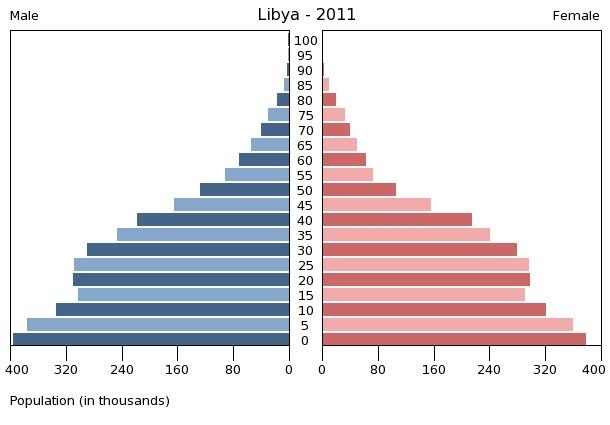
The population pyramid of Libya is relatively small at the top and bottom with a pretty large number of working age adults, with a dependency ratio of 52.1 which is lower than that of Ethiopia. The life expectancy of Libya, which is 75 years, is greater than Ethiopia as well. The bottom of the pyramid is significantly smaller which shows that the NIR might actually be decreasing.
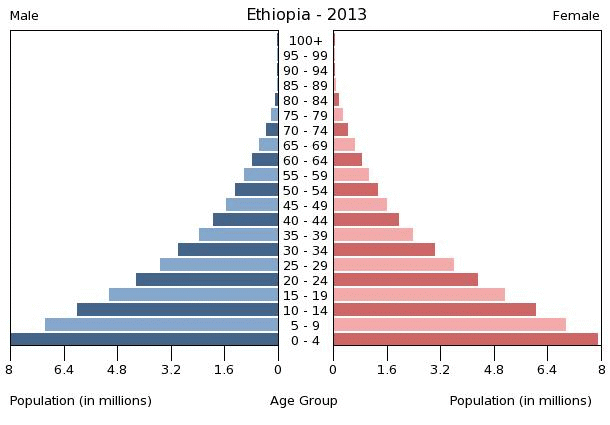
The population pyramid of Ethiopia is extremely different from Libya, because the number of elderly people is very small which tells us that the life expectancy (60 years) must also be low. The high number of younger people and a dependency ratio of 85% tells us that the Crude Birth Rate is very high, at 38.07/1000 population. The large number of young people in the country shows that the NIR is increasing greatly.
In Ethiopia, the current migration trend is to migrate out, and the country currently has a Net Migration Rate of -0.23 (CIA World Fact Book). A heavy percentage of Ethiopians migrate out to Sudan, Israel, and America. On the other hand, those that do migrate to Ethiopia are from Somalia, and Somali land (IOM). Most internal migration is to the Ethiopian northeast coast. Ethiopia has no quotas, and one of the major push factors for migration is famine.
Opposite of Ethiopia, The trend in Libya is to migrate in, with a Net Migration Rate of 33.32. Most migrants in Libya come from Egypt, Tunisia, and Syria (Migrationpolicy.com). Those that migrate out go to America, Israel, and Chad. One of the major pull factors to Libya is its relative political stability, and its acceptance of refugees.
On the other hand, Libya exceeds Ethiopia considerably in population growth with a Natural Increase Rate of 4.85 (CIA World Fact Book). The current population of Libya is however, less than Ethiopia with 6,002,347 people. The Crude Birth Rate of Libya is at 18.74, and the Total Fertility Rate of 2.09 children born/woman (CIA World Fact Book). Libya is in stage 3, with a median age of 27 year old people. The usual life expectancy for a Libyan is 75.83 years, and the Infant Mortality Rate is 12.26 deaths/1000 live births. The probability of dying between 15 and 60 years is 411/134 (World Health Organization). An effect of Libya's high growth is that one of the main problems it has are AIDS, and road traffic injuries.
The population pyramid of Libya is relatively small at the top and bottom with a pretty large number of working age adults, with a dependency ratio of 52.1 which is lower than that of Ethiopia. The life expectancy of Libya, which is 75 years, is greater than Ethiopia as well. The bottom of the pyramid is significantly smaller which shows that the NIR might actually be decreasing.
The population pyramid of Ethiopia is extremely different from Libya, because the number of elderly people is very small which tells us that the life expectancy (60 years) must also be low. The high number of younger people and a dependency ratio of 85% tells us that the Crude Birth Rate is very high, at 38.07/1000 population. The large number of young people in the country shows that the NIR is increasing greatly.
In Ethiopia, the current migration trend is to migrate out, and the country currently has a Net Migration Rate of -0.23 (CIA World Fact Book). A heavy percentage of Ethiopians migrate out to Sudan, Israel, and America. On the other hand, those that do migrate to Ethiopia are from Somalia, and Somali land (IOM). Most internal migration is to the Ethiopian northeast coast. Ethiopia has no quotas, and one of the major push factors for migration is famine.
Opposite of Ethiopia, The trend in Libya is to migrate in, with a Net Migration Rate of 33.32. Most migrants in Libya come from Egypt, Tunisia, and Syria (Migrationpolicy.com). Those that migrate out go to America, Israel, and Chad. One of the major pull factors to Libya is its relative political stability, and its acceptance of refugees.
|
|

Ethiopian migrants
